

Constellation Software KPI Insights
In which direction is the business headed?

Note: I use Stratoshphere to help with my research, to follow my holdings, screen for ideas and get insights to company specific KPI’s that drive the business results. I also use it for charting in my content to visualize data. Get 25% off a great stock research platform, stratosphere.io
"If a business does well, the stock eventually follows." - Warren Buffett
Constellation Software is my largest holding. It has a wonderful business model that has been covered many times elsewhere very well. What I’d like to do is assess the fundamental health of the business model underlying the stock and judge its path ahead as best as possible, partly by looking at a few of the KPIs (key performance indicators) that I believe tells the story succinctly.
Constellation is a serial acquirer that has an extremely decentralized structure for operating and capital allocation. It shares best practices but does not integrate. It relies on finding and acquiring many small vertical market software businesses globally based on the individual operating groups and their subordinates’ expertise and relationships with their verticals. Being able to do many small deals has been the key to compounding investors’ capital for the past decade and more. Also being able to get some organic growth has been helpful. Scale sustainability for acquisitions and some sustainable organic growth is the key to future success.
As a primer, you can review the data from RBC estimates from 2015 to 2022 to get a sense for the usual performance of the modern version of Constellation. One key thing to keep in mind is the amount of capital spent on large acquisitions which is somewhat lumpy in nature and explains some of the variance. For 2022, the All-Scripts purchase was a large acquisition representing around half of the capital deployed.
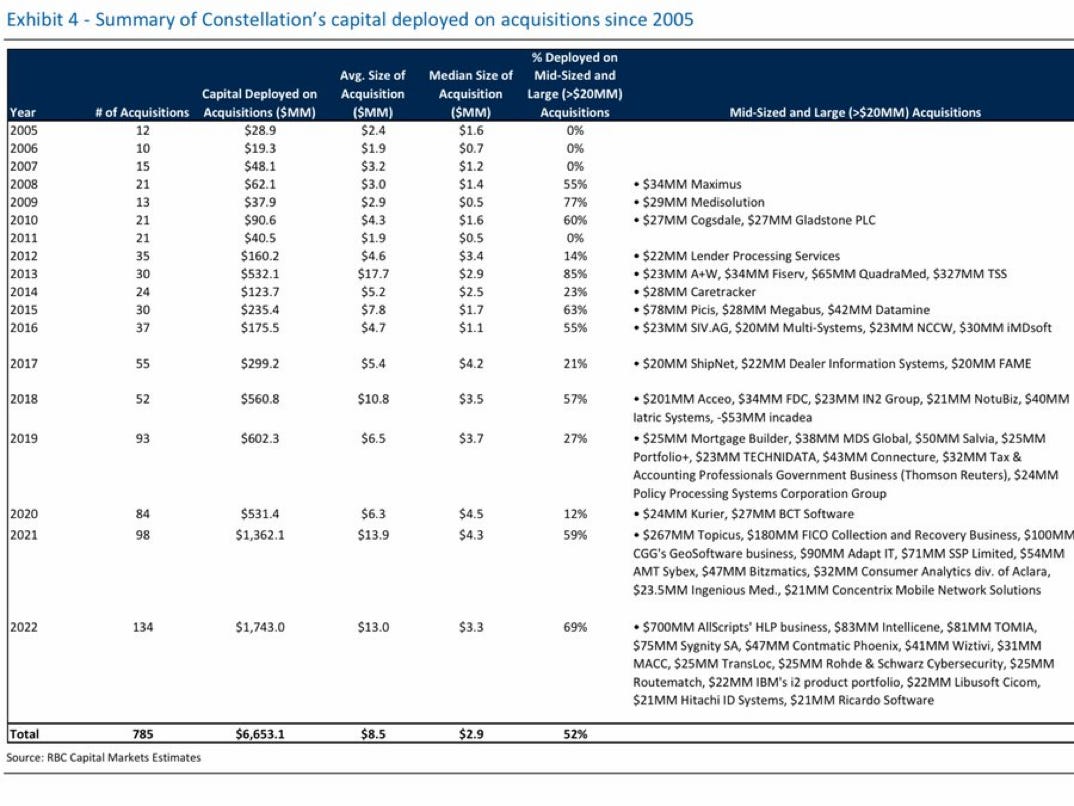
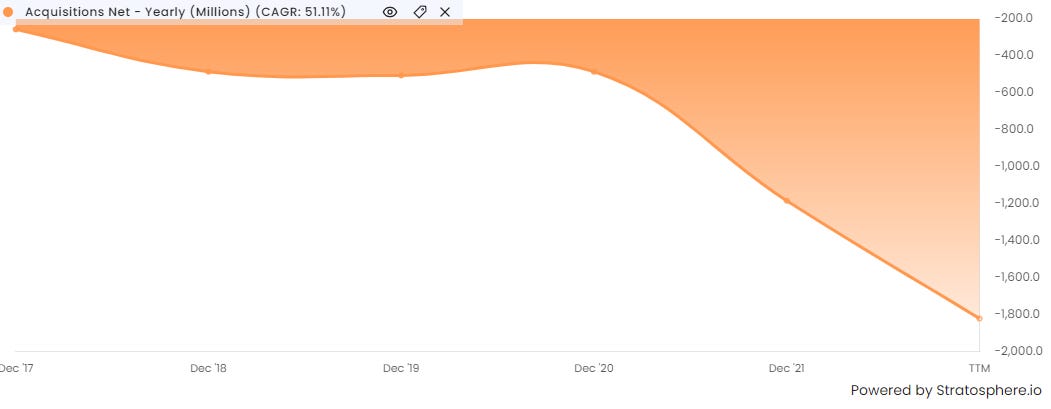
Deployment of Capital (Leading KPI)
Being able to deploy more and more capital as the operating groups within Constellation grow has always been a concern for top managers and investors alike. Many serial acquirers have trouble with this and typically this results in larger deals instead of scaling out the capabilities and decentralizing the capital deployment decisions within the organizations. There doesn’t appear to be any weakness here yet. Managers have commented recently that the number of companies targeted on their lists that they keep contact with for future acquisitions is still growing.
Without the AllScripts purchase, this KPI would not have looked as good, so keep that in mind. Future success will rely on being able to find and complete 1 or 2 large deals a year going forward. Lumps in the data will likely result, I would suspect.
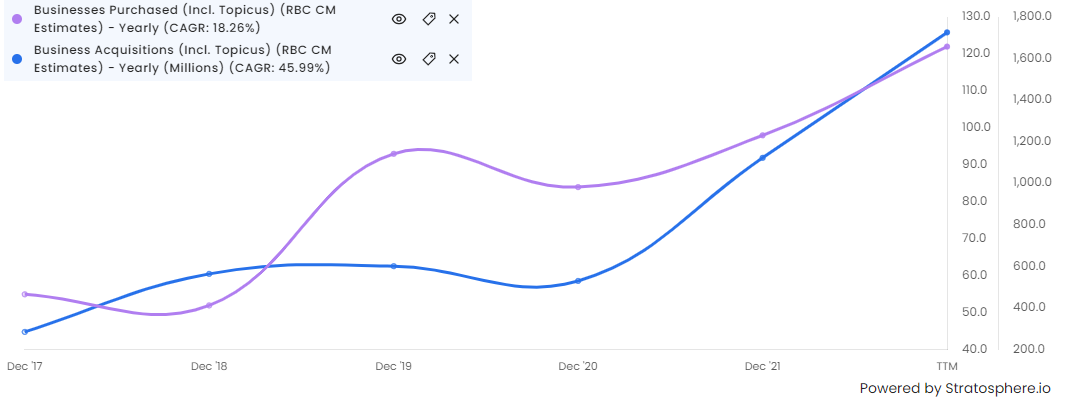
Number of Acquisitions (Leading KPI)
The number of acquisitions is a key to understanding if the organization has been able to scale. The model for Constellation is to grow not only its acquisitions but its in house talent to source and complete acquisitions over time. This appears to be on the right track.
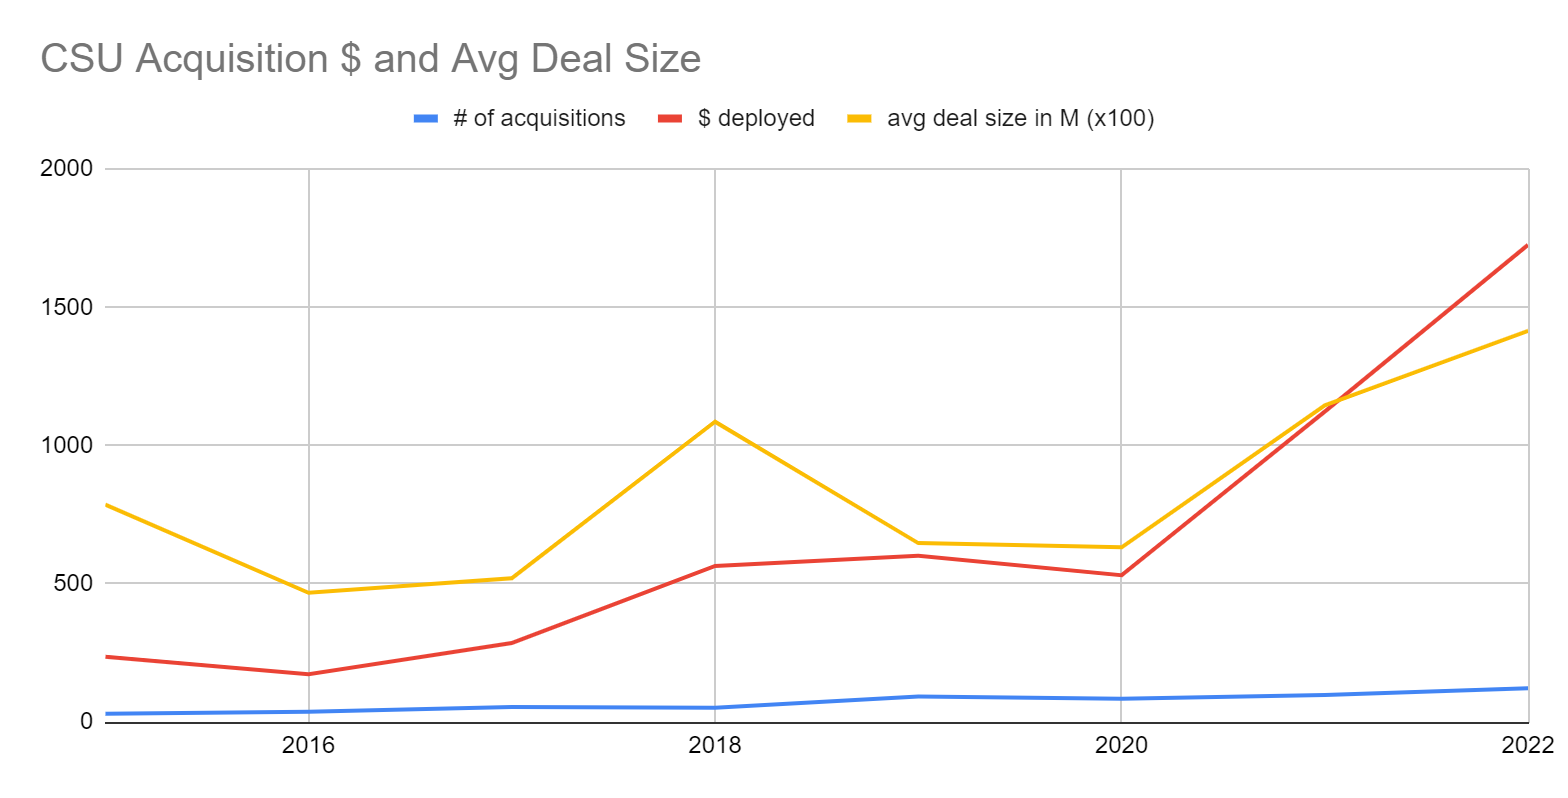
Average Price of Acquisitions (Leading KPI)
The average price at first glance has jumped. This would be worrying but we know that Constellation now has to do a few large deals to successfully deploy all its capital. If you remove AllScripts from the equation, the average price is closer to 7 million dollars. This is in line with the company’s history.
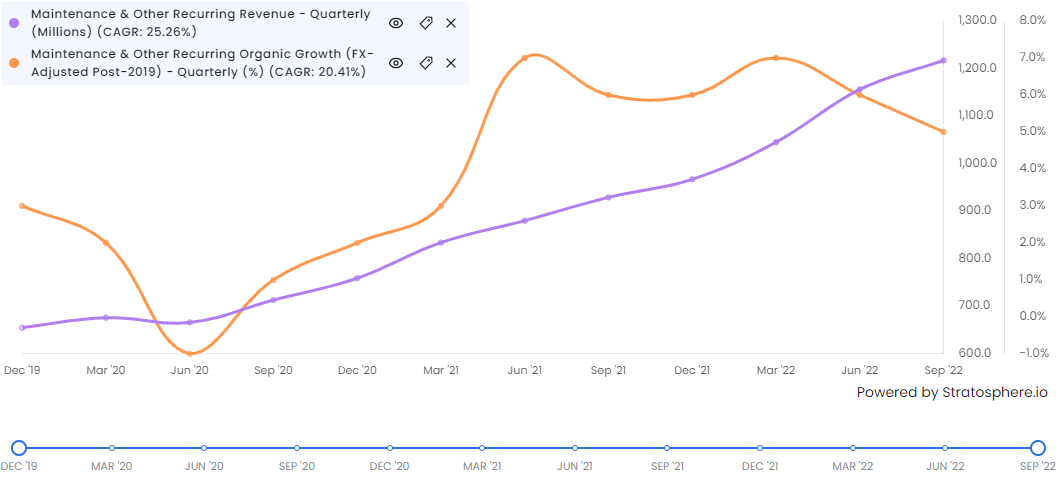
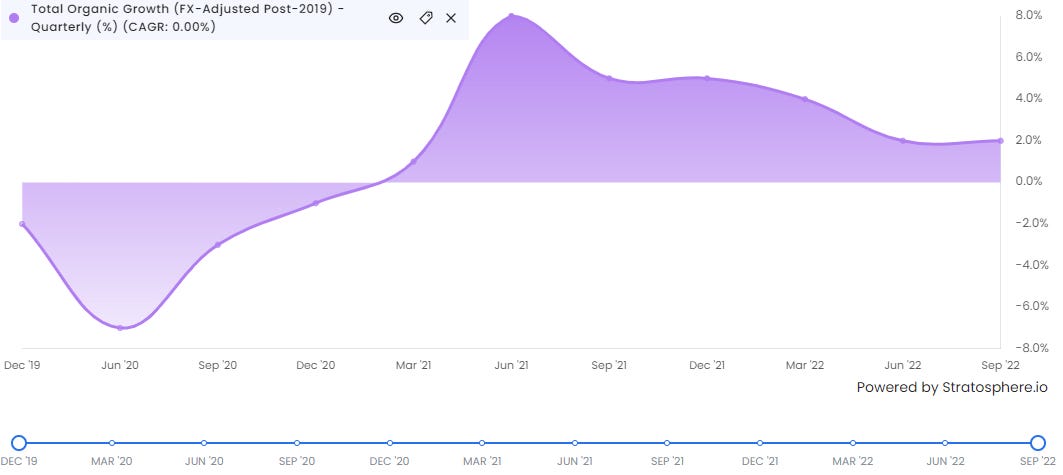
Organic Growth (Lagging KPI)
Speaking of lumpiness. Organic growth is a key metric to understand how much they are able to leverage existing assets to fuel growth. It is the cherry on top as it often has less financial cost compared with growth with acquisitions. The key segments for organic growth will be recurring revenue lines. It has been relatively good in recent quarters but nothing to brag about either. Not as bad as most people think but also something the company would love to do better with. Probably something to keep an eye on closely.
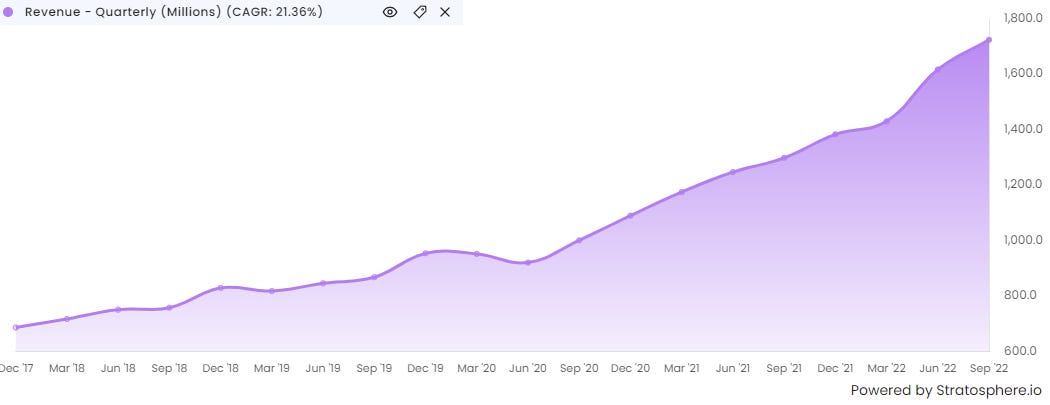
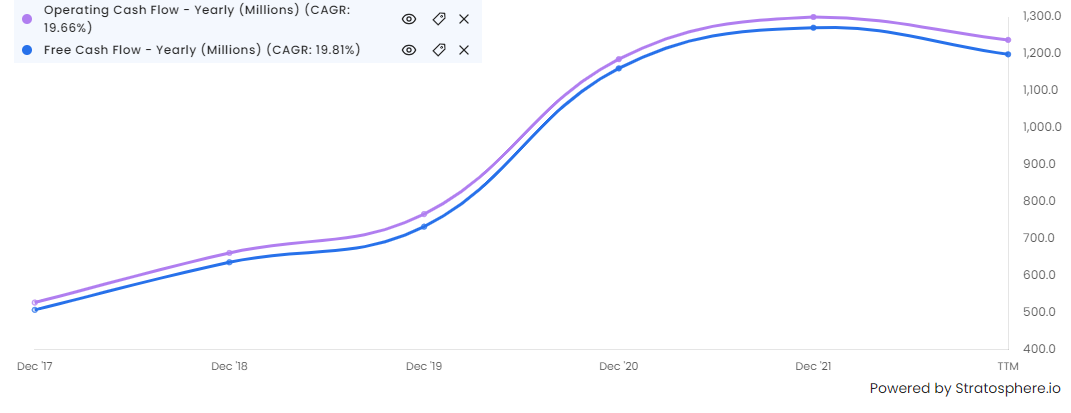
Revenue and Cash Flow Growth (Lagging KPI)
Revenue and cash flow are the ultimate output for performance and is very much a lagging indicator. Revenue growth keeps chugging along with a >20% compound annual growth rate.
Some other qualitative and quantitative reviews from the operating groups 2022 performance linked below:
If you enjoyed these charts, check out stratoshphere.io and use code SIMONH for a 25% discount on your first year.
That’s it for now, check back soon for more. As always, follow me on twitter and please share this with anyone who might interested in my work. My work is now completely free for all but there is an option for a low cost paid subscription as a way to support my work.
Thanks for this--if possible, could you please link me to some of your favorite recent writeups on the company, thank you!